DATA VIZ
Grammarly
Selected data visualizations


CASE STUDY
Health Research Start-up
Design a system for data visualization
IDHea Brief brief
WHAT
Visually represent the health datasets, in order to educate and guide researchers.
WHERE
The visualizations will be used to promote, educate, and sell IDHea on social, web, video, and events.
HOW
Phase 1 (launch): Three datasets. First audience is early adopters, with the goals of education and adoption.
Phase 2 (iterative): Enhance two existing sets, plus adding 3-4 more datasets annually.
GOALS
1. Define the variables for display
(which ones and how many)
2. Define vizualization type for each
variable set (Mary to give feedback)
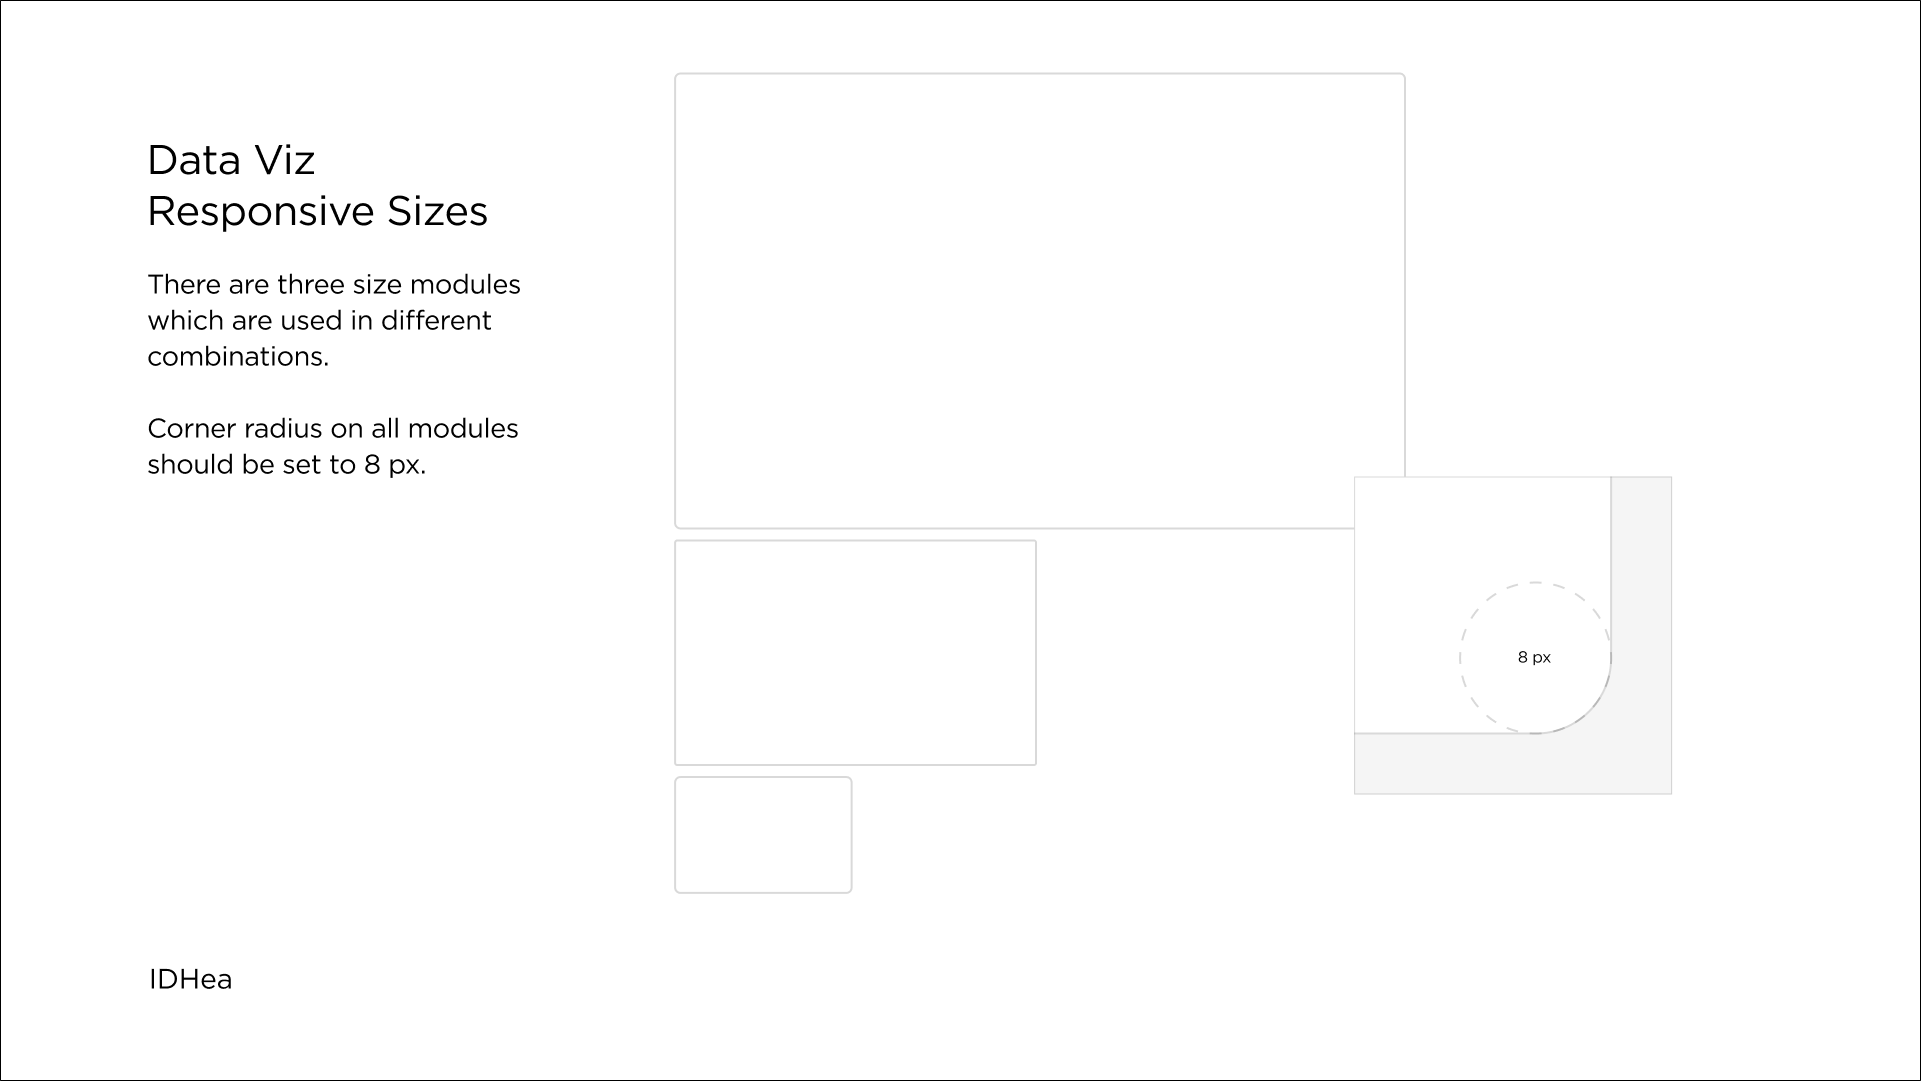
3. Modular units to scale and repeat.
4. Dashboard of modular elements.
5. Quality over quantity.
PROCESS
Start with single data set.
Create data viz system.
Apply system to all data sets.
TIMELINE
First set, first draft (March 17 EOD)
Set 2 final data sets
Set 2 visualization (March 21)
Set 3 final data sets
Set 3 (March 21)
Launch (May 3)
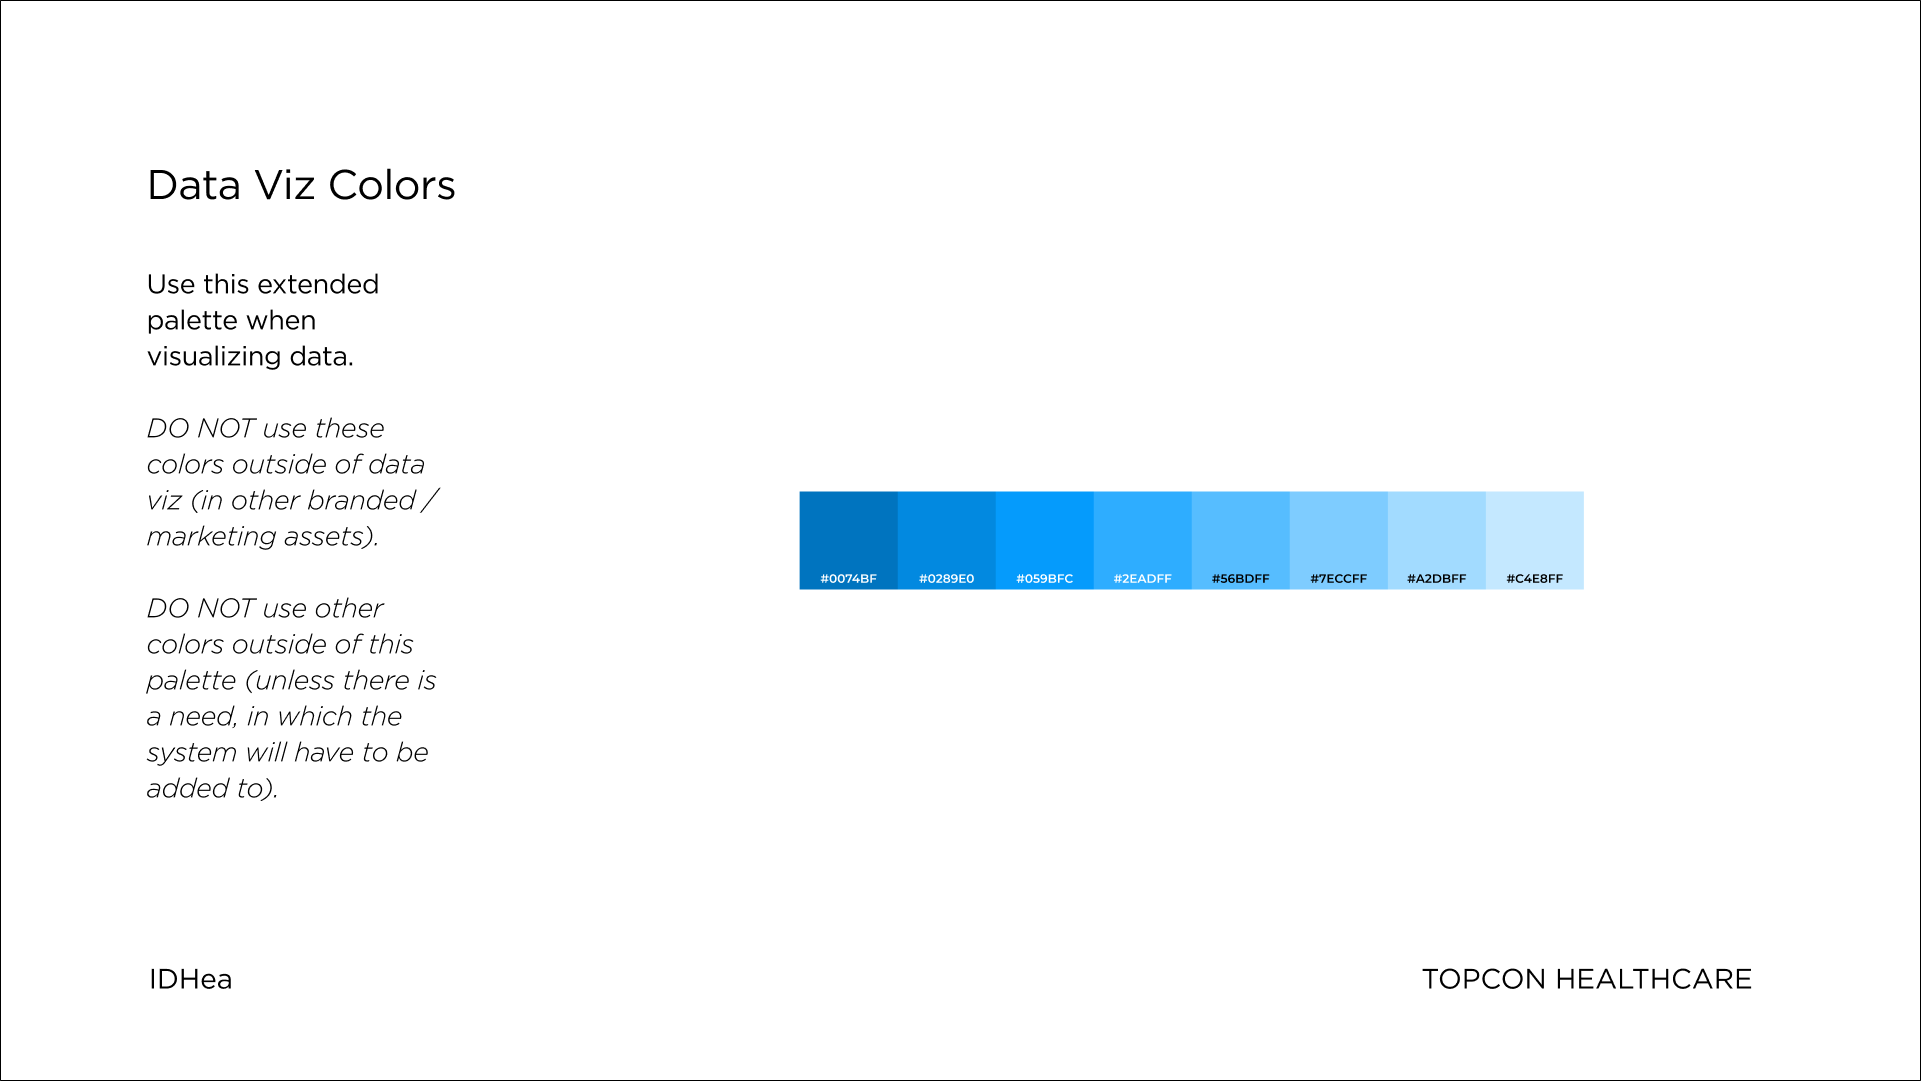
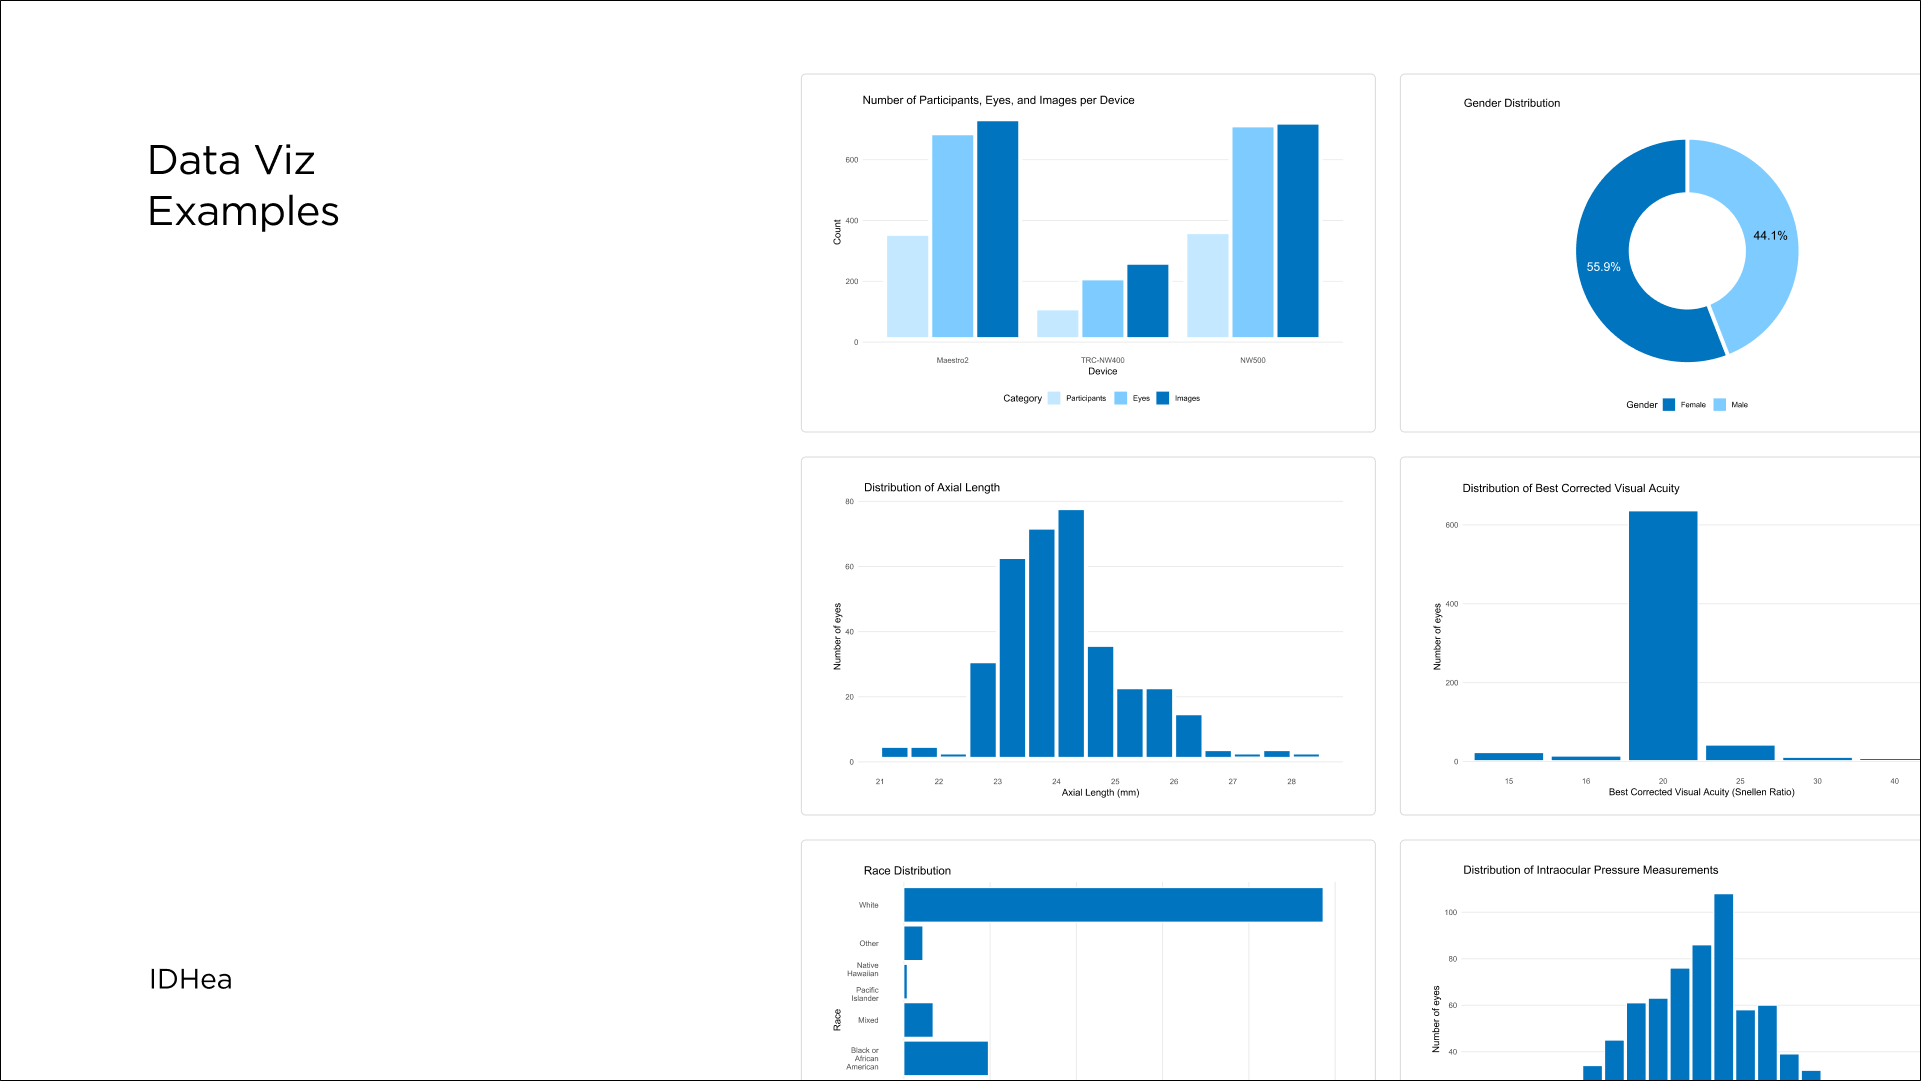
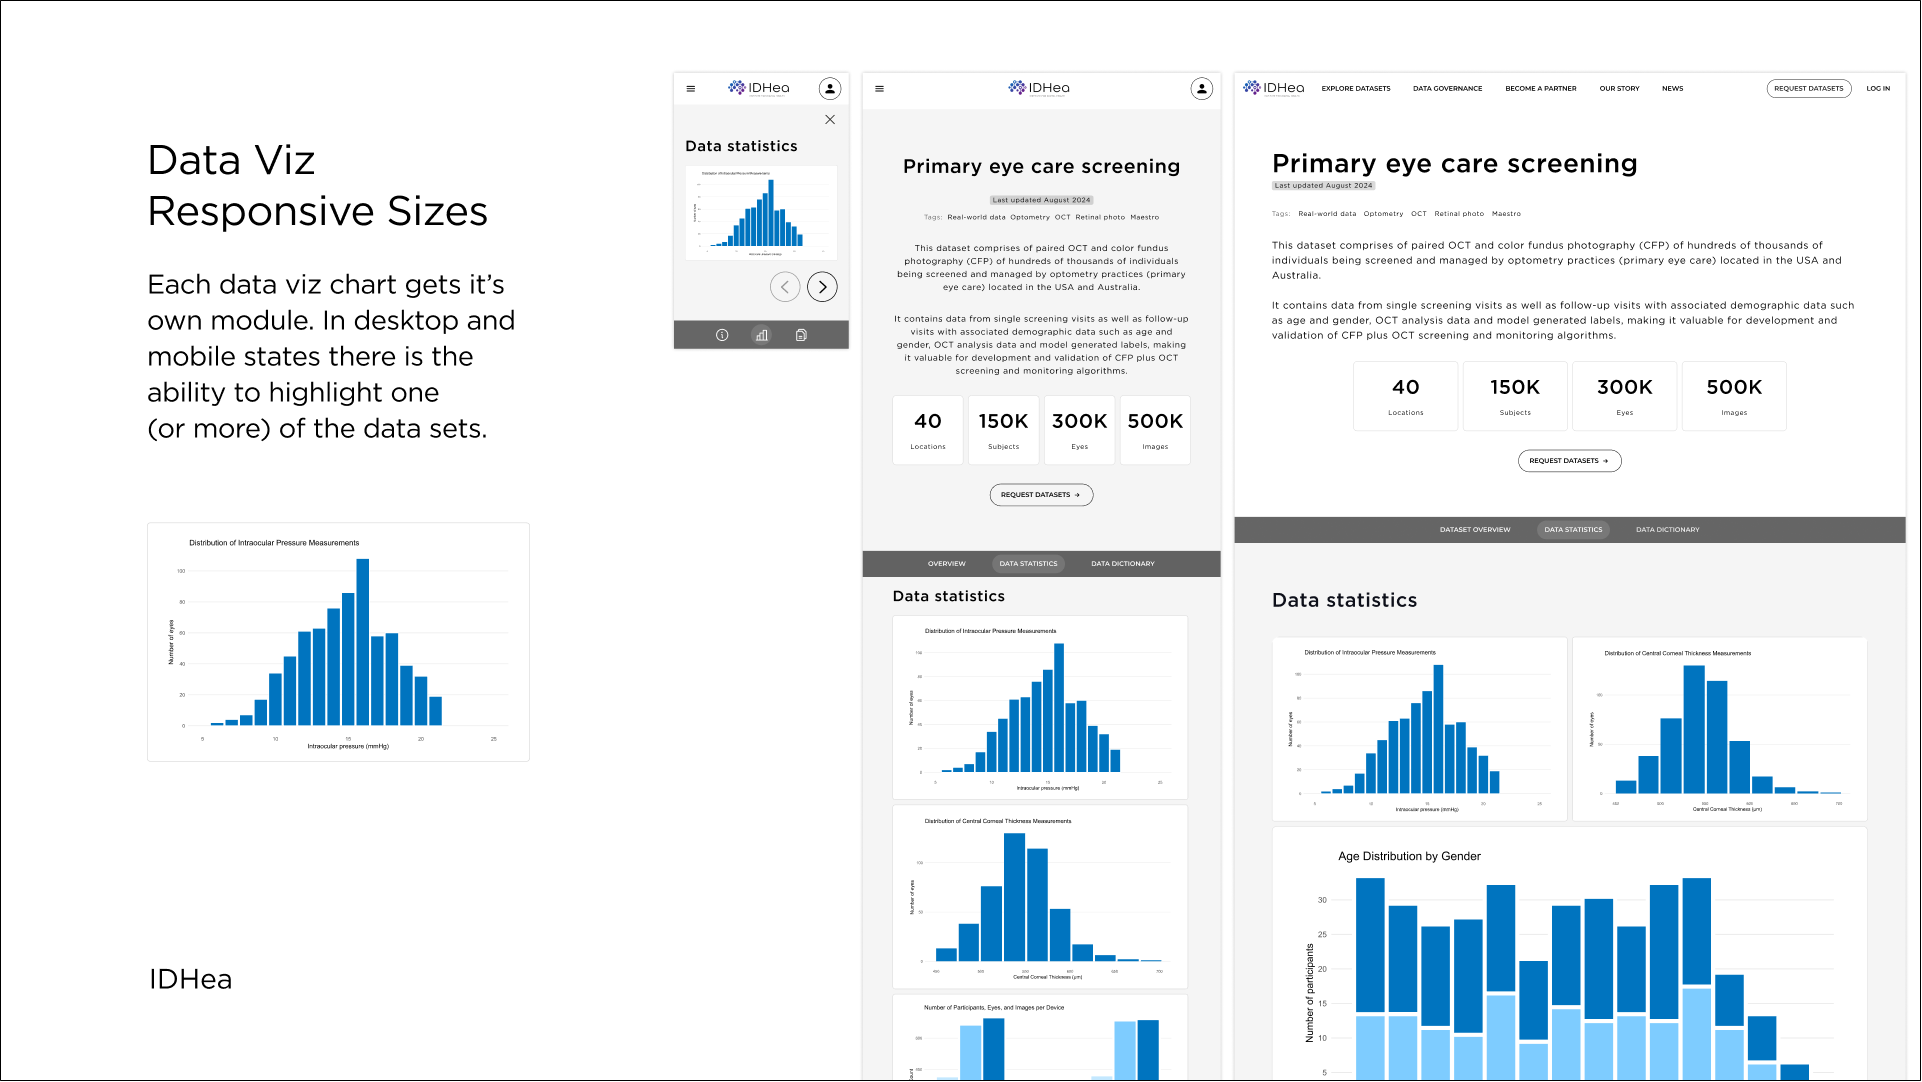
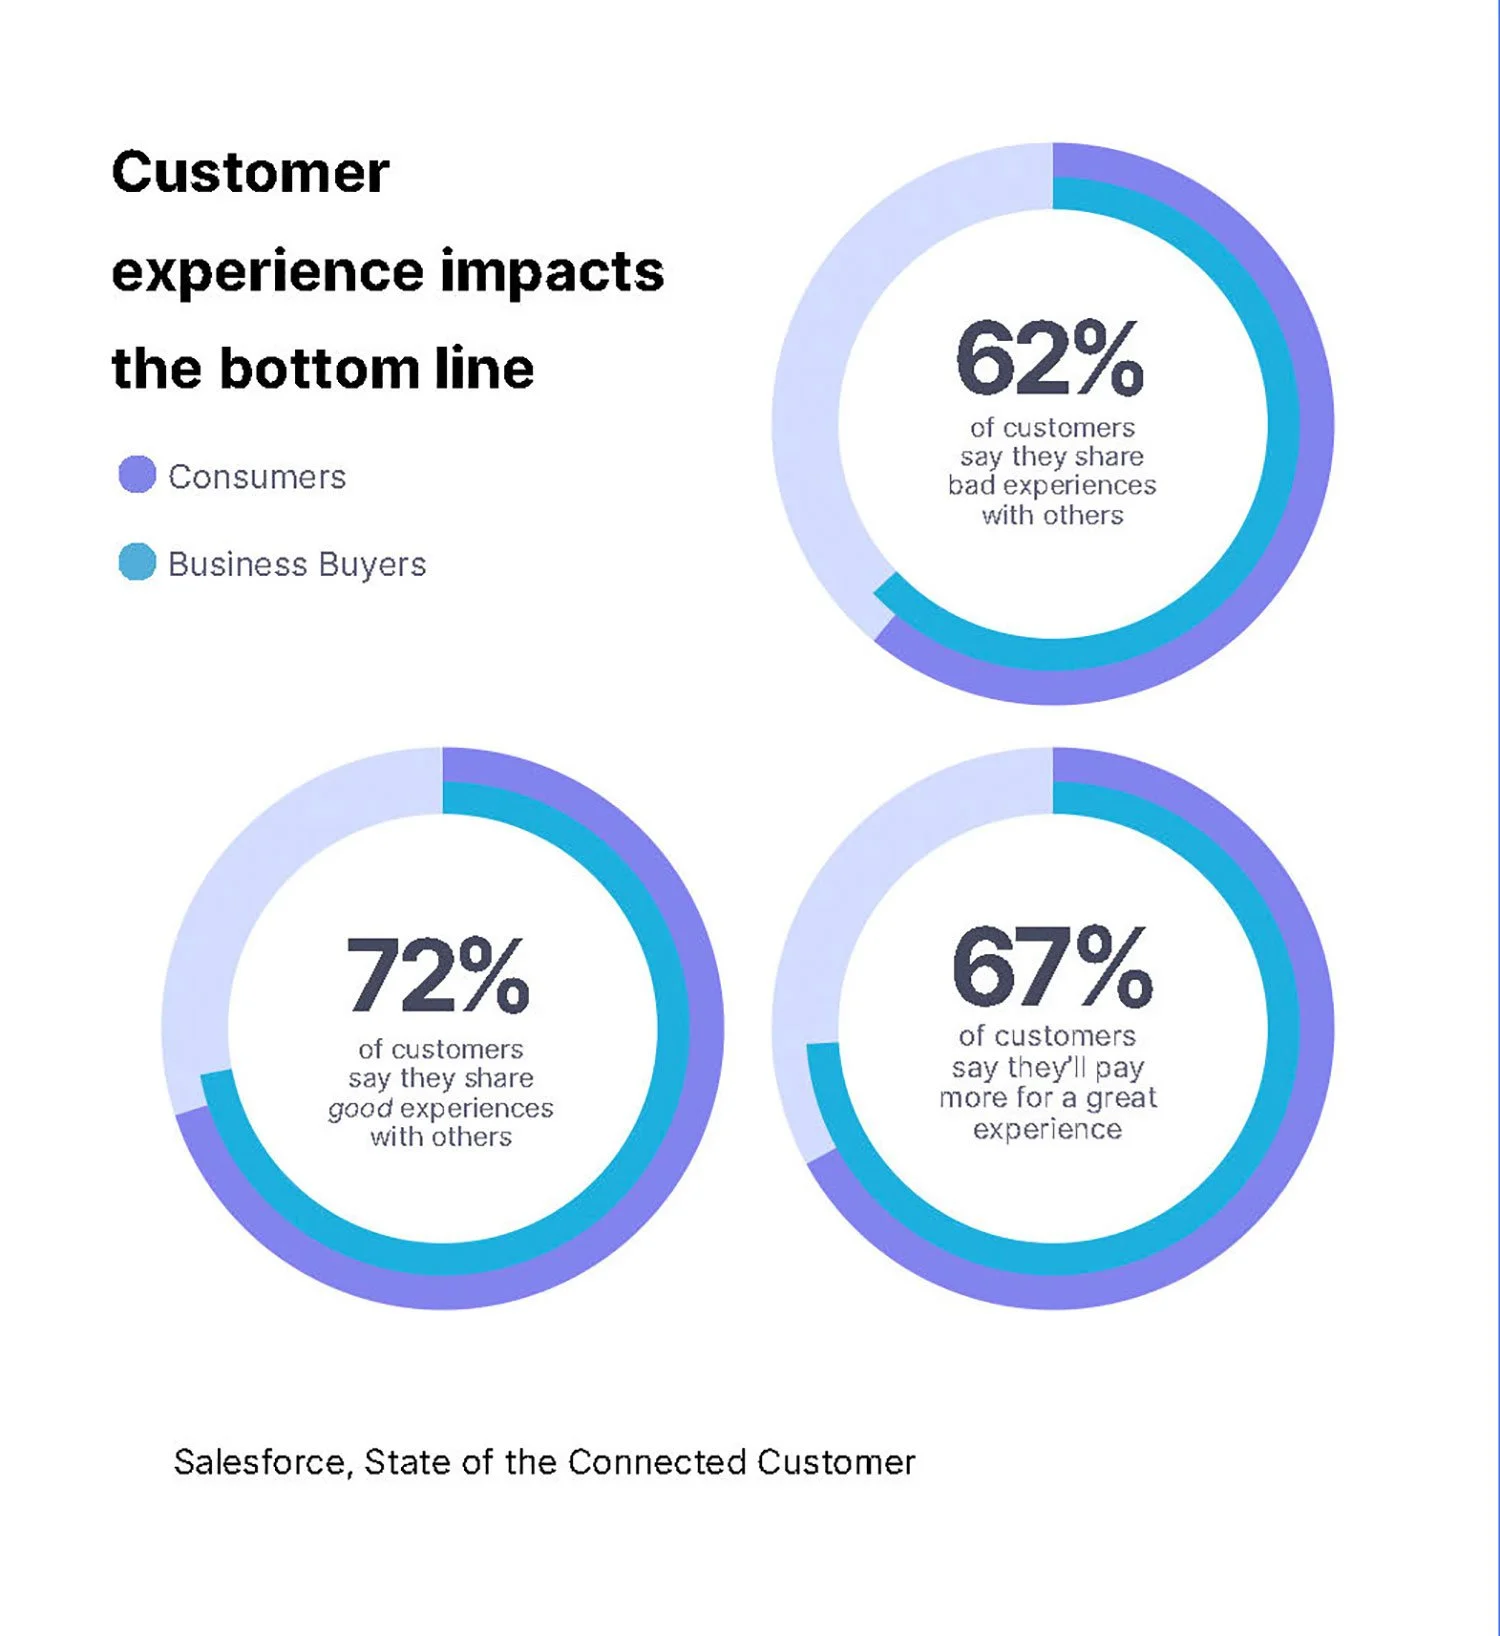
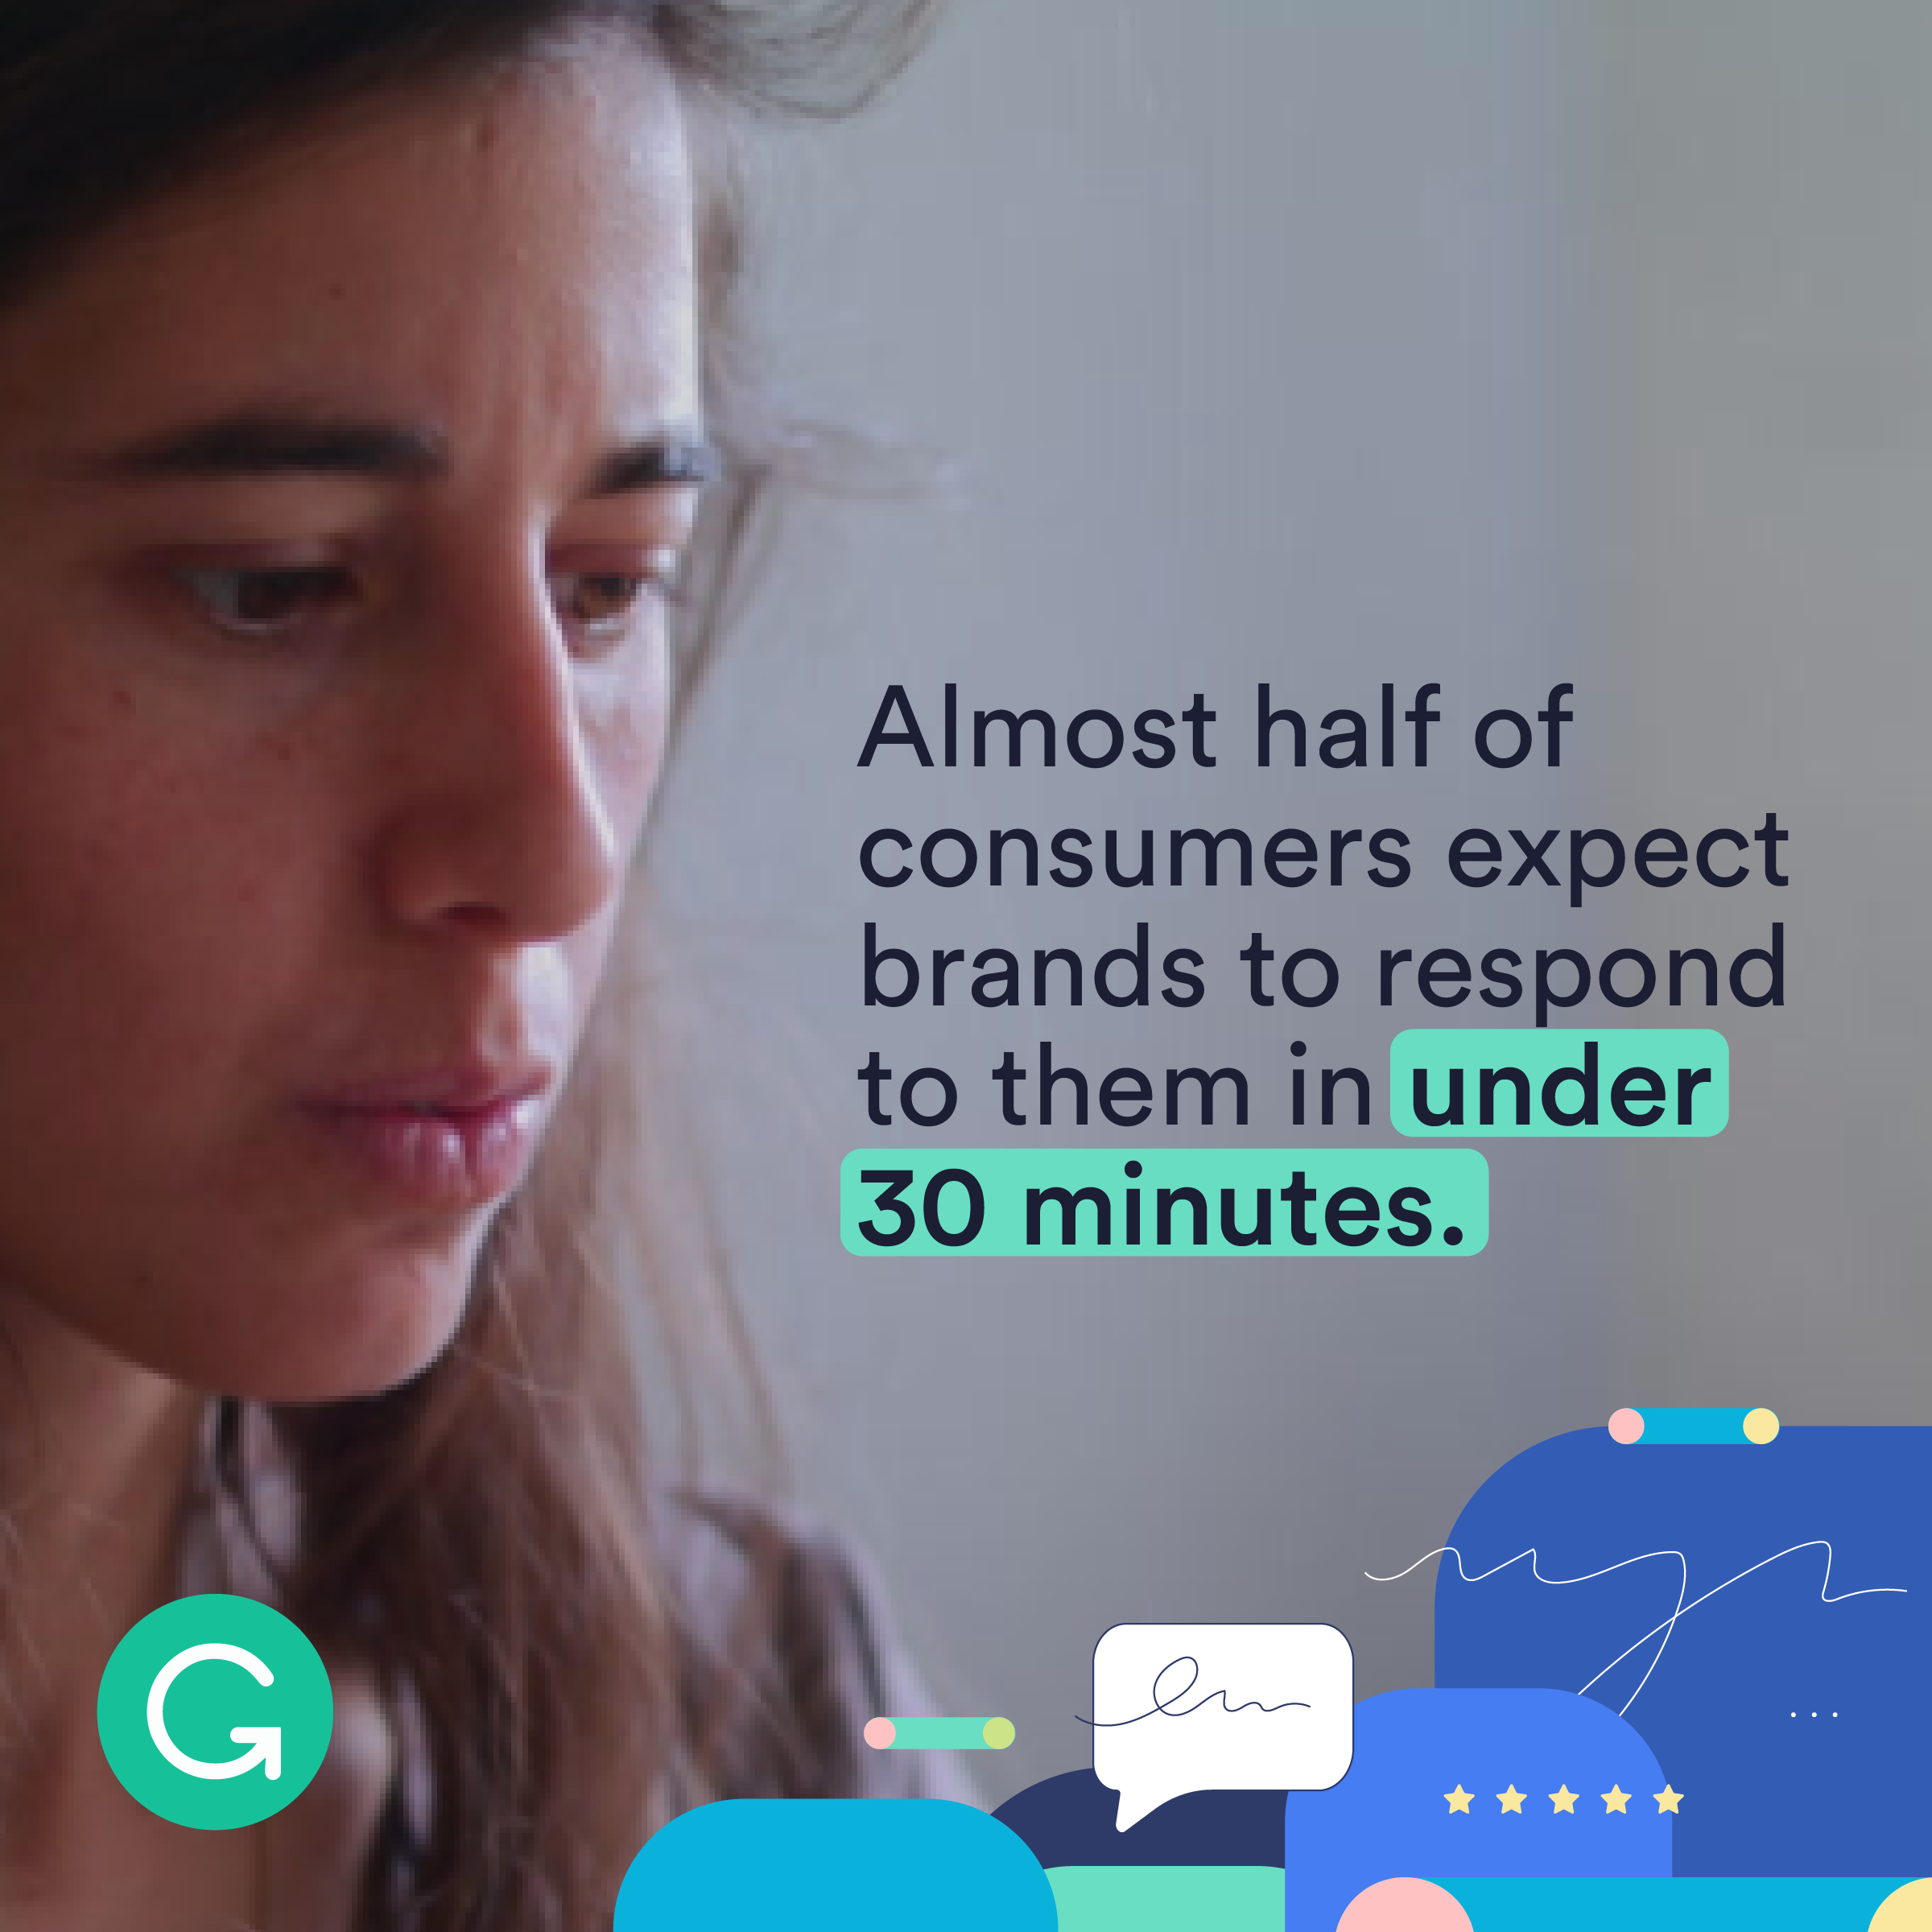
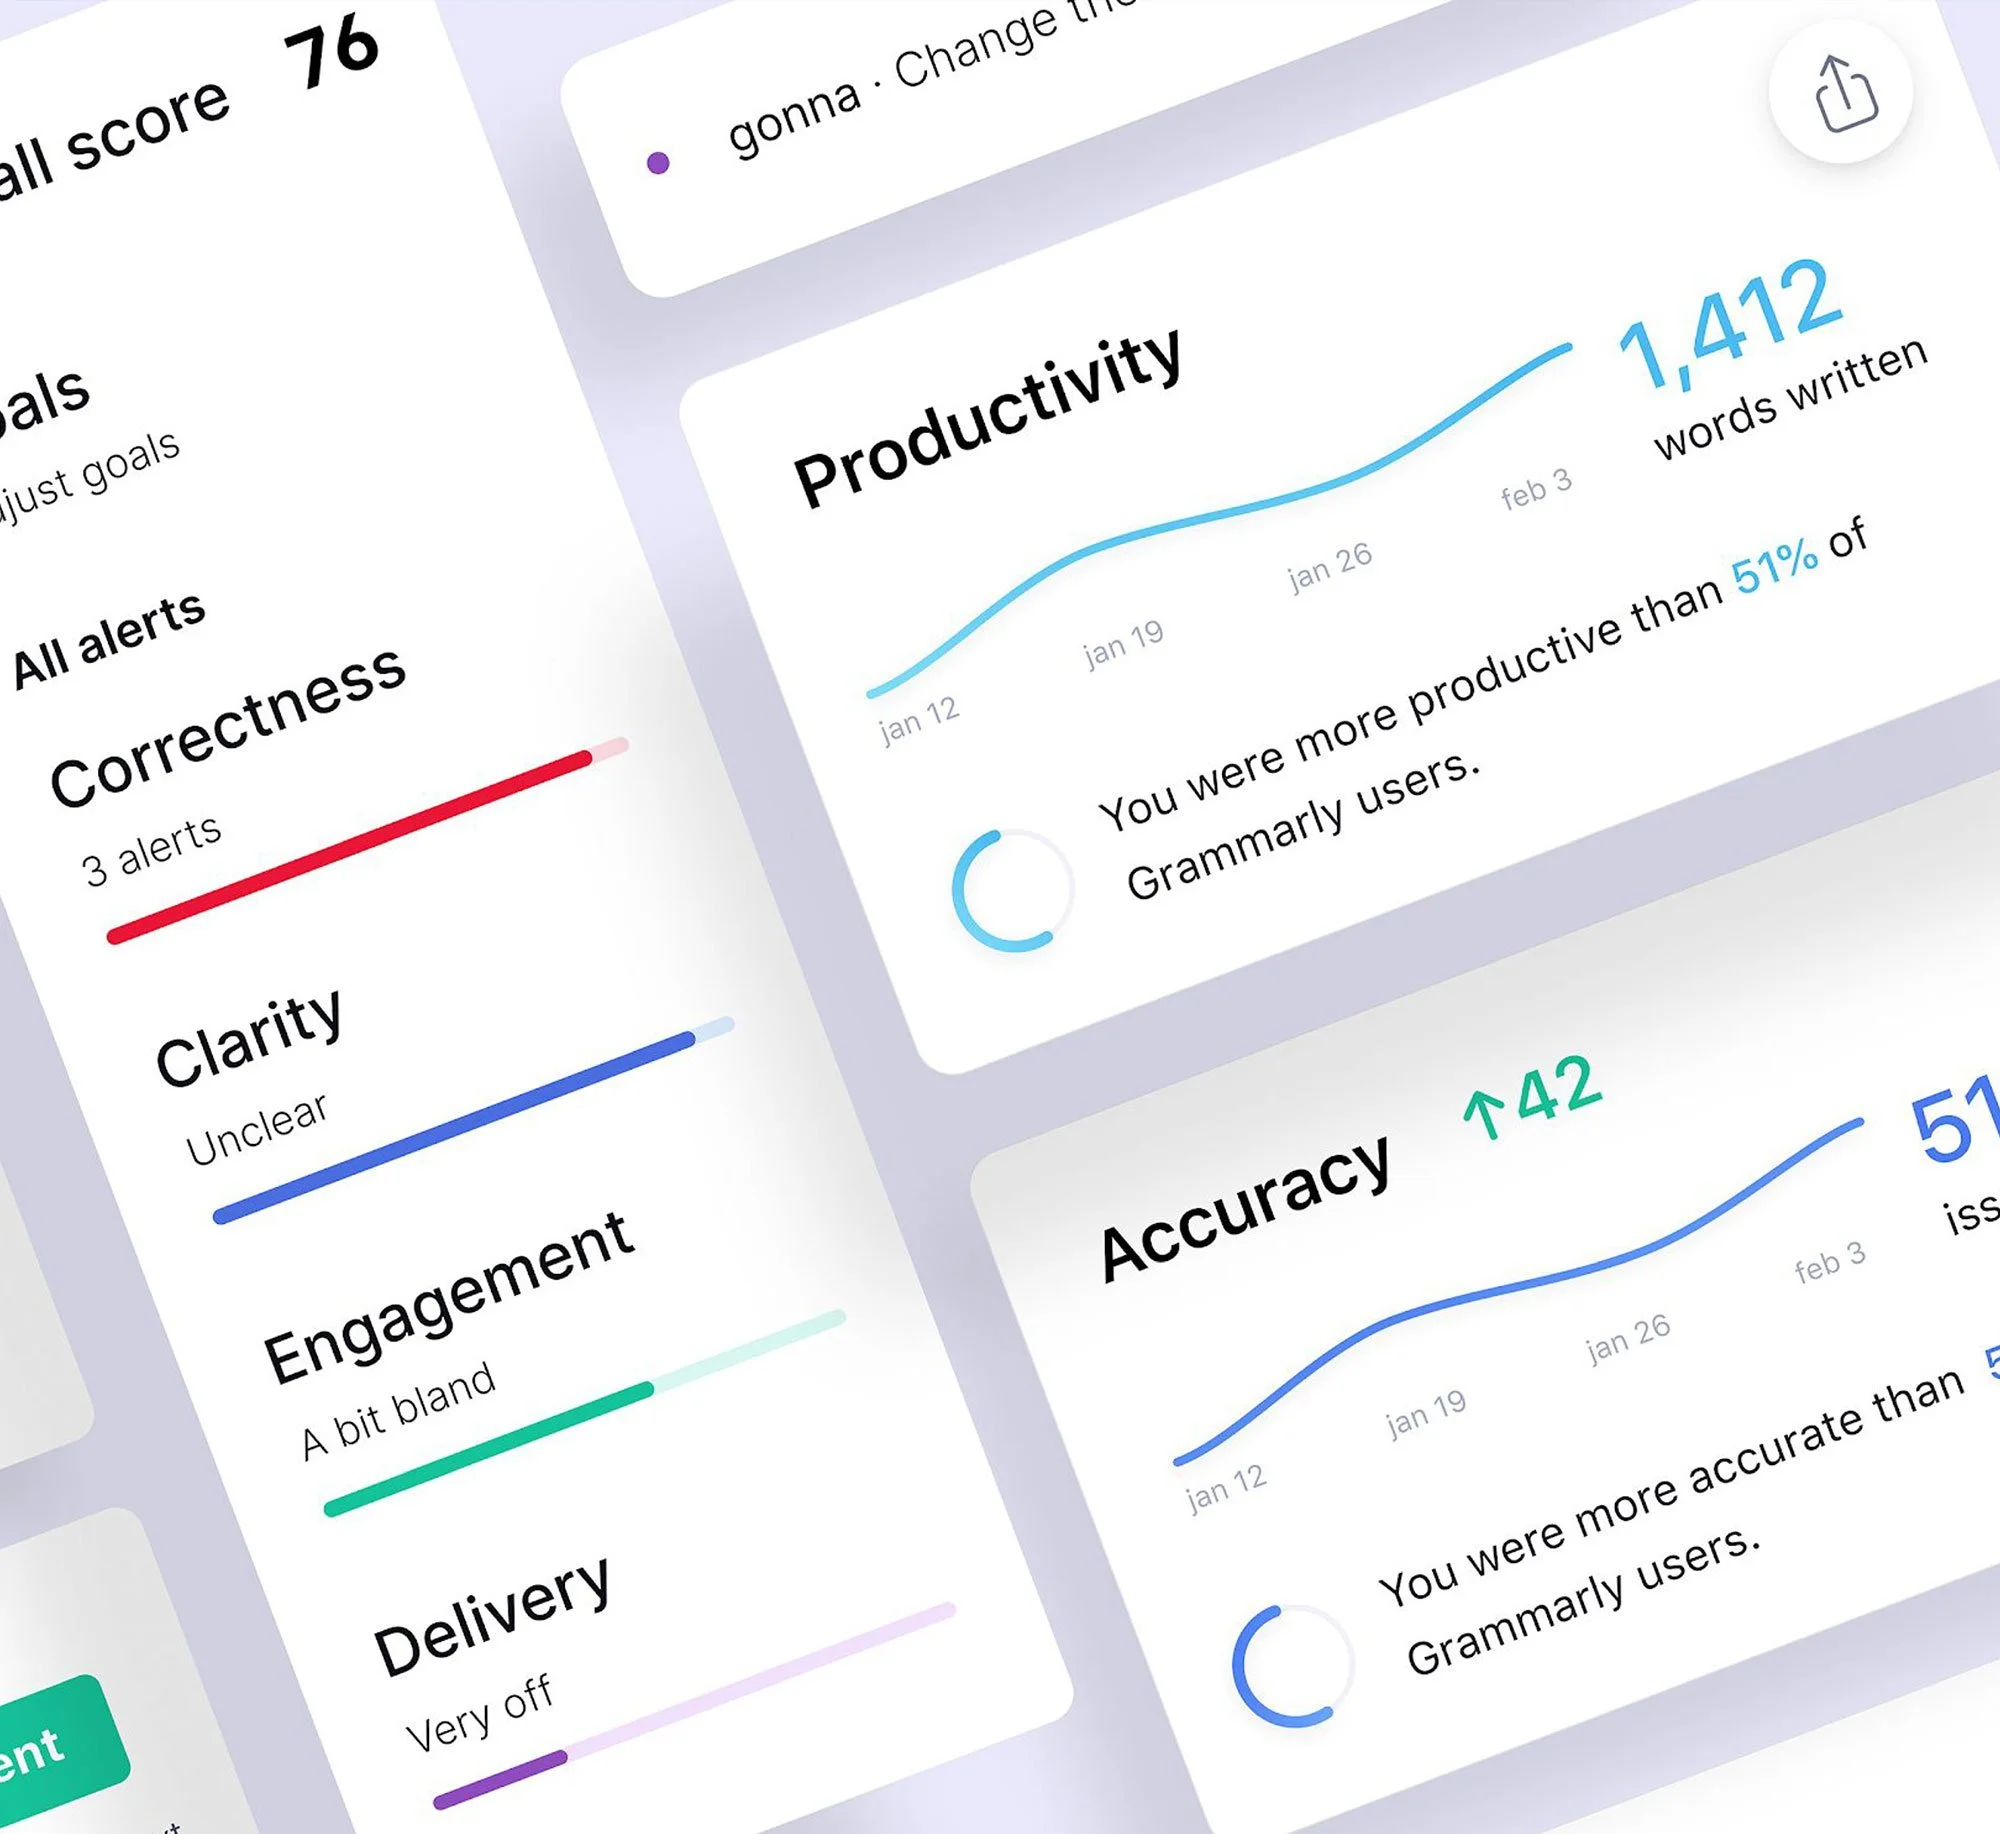
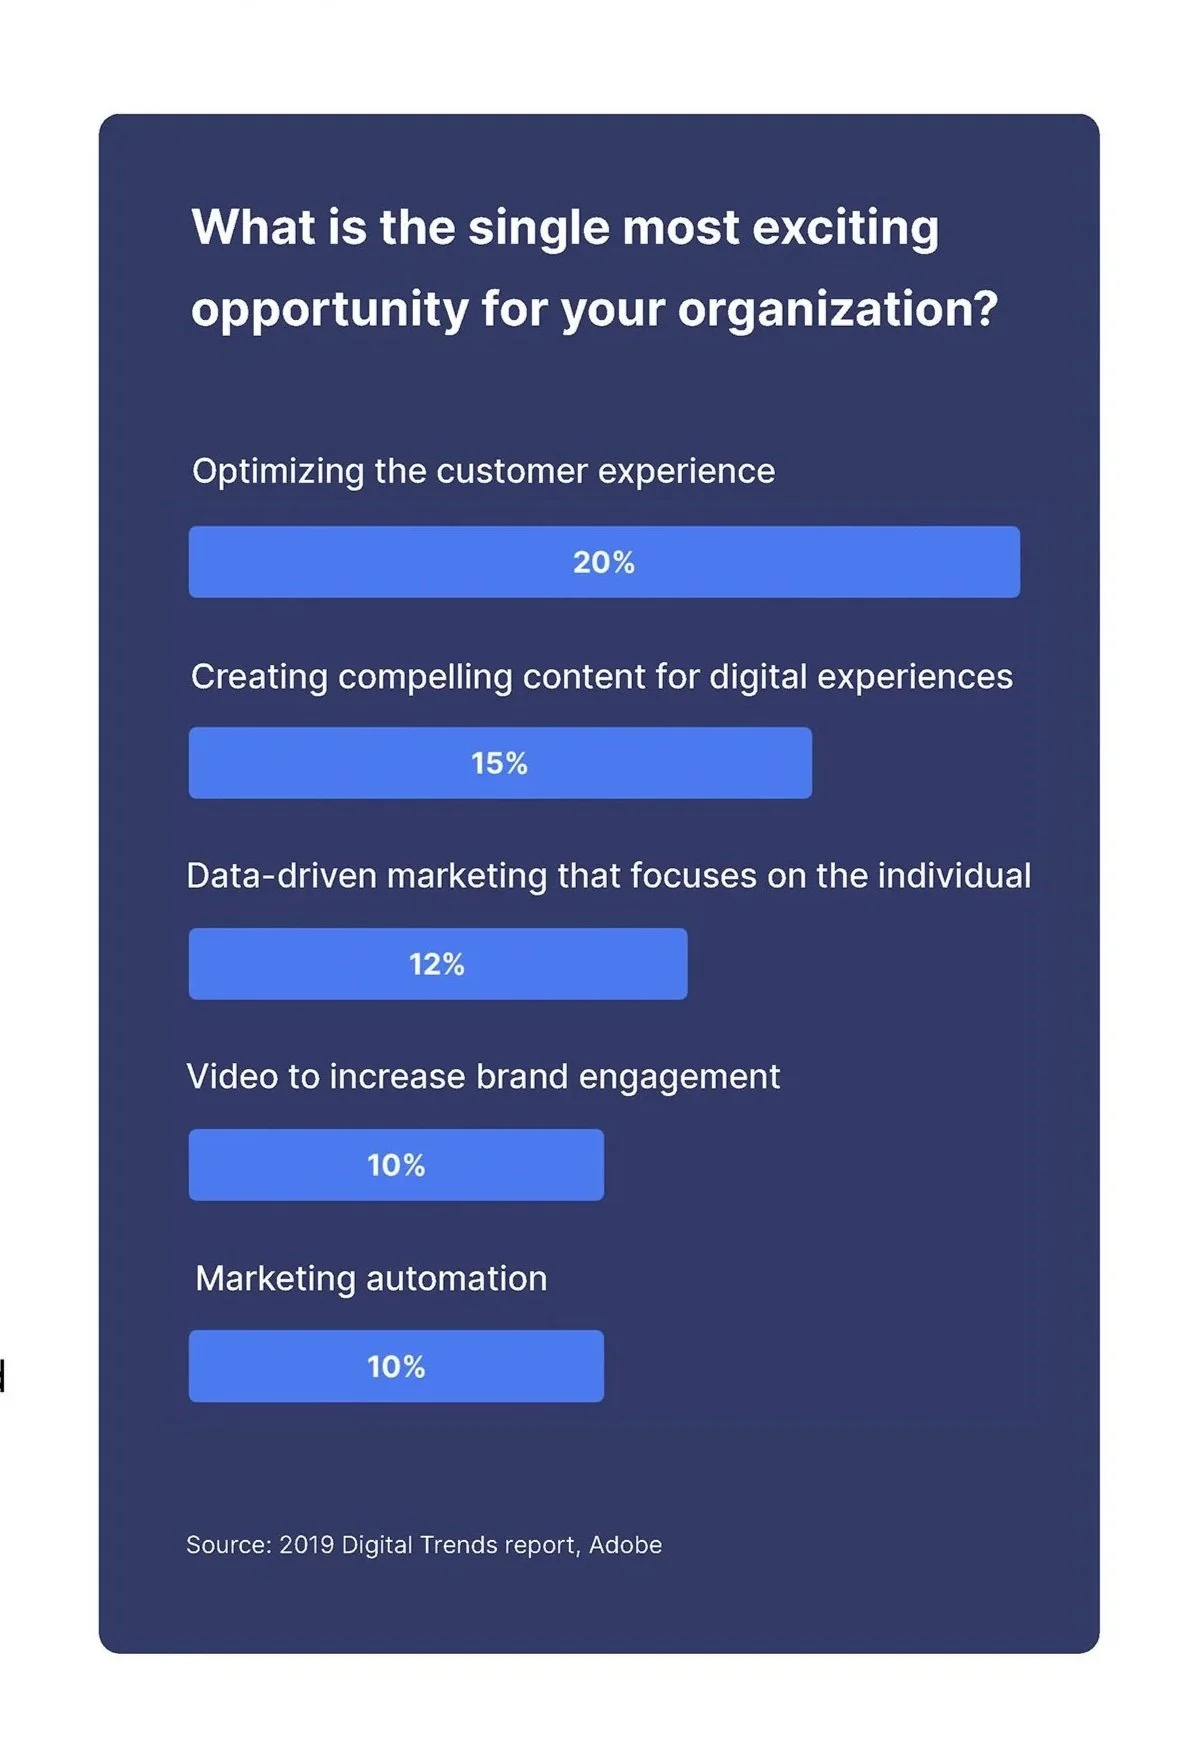
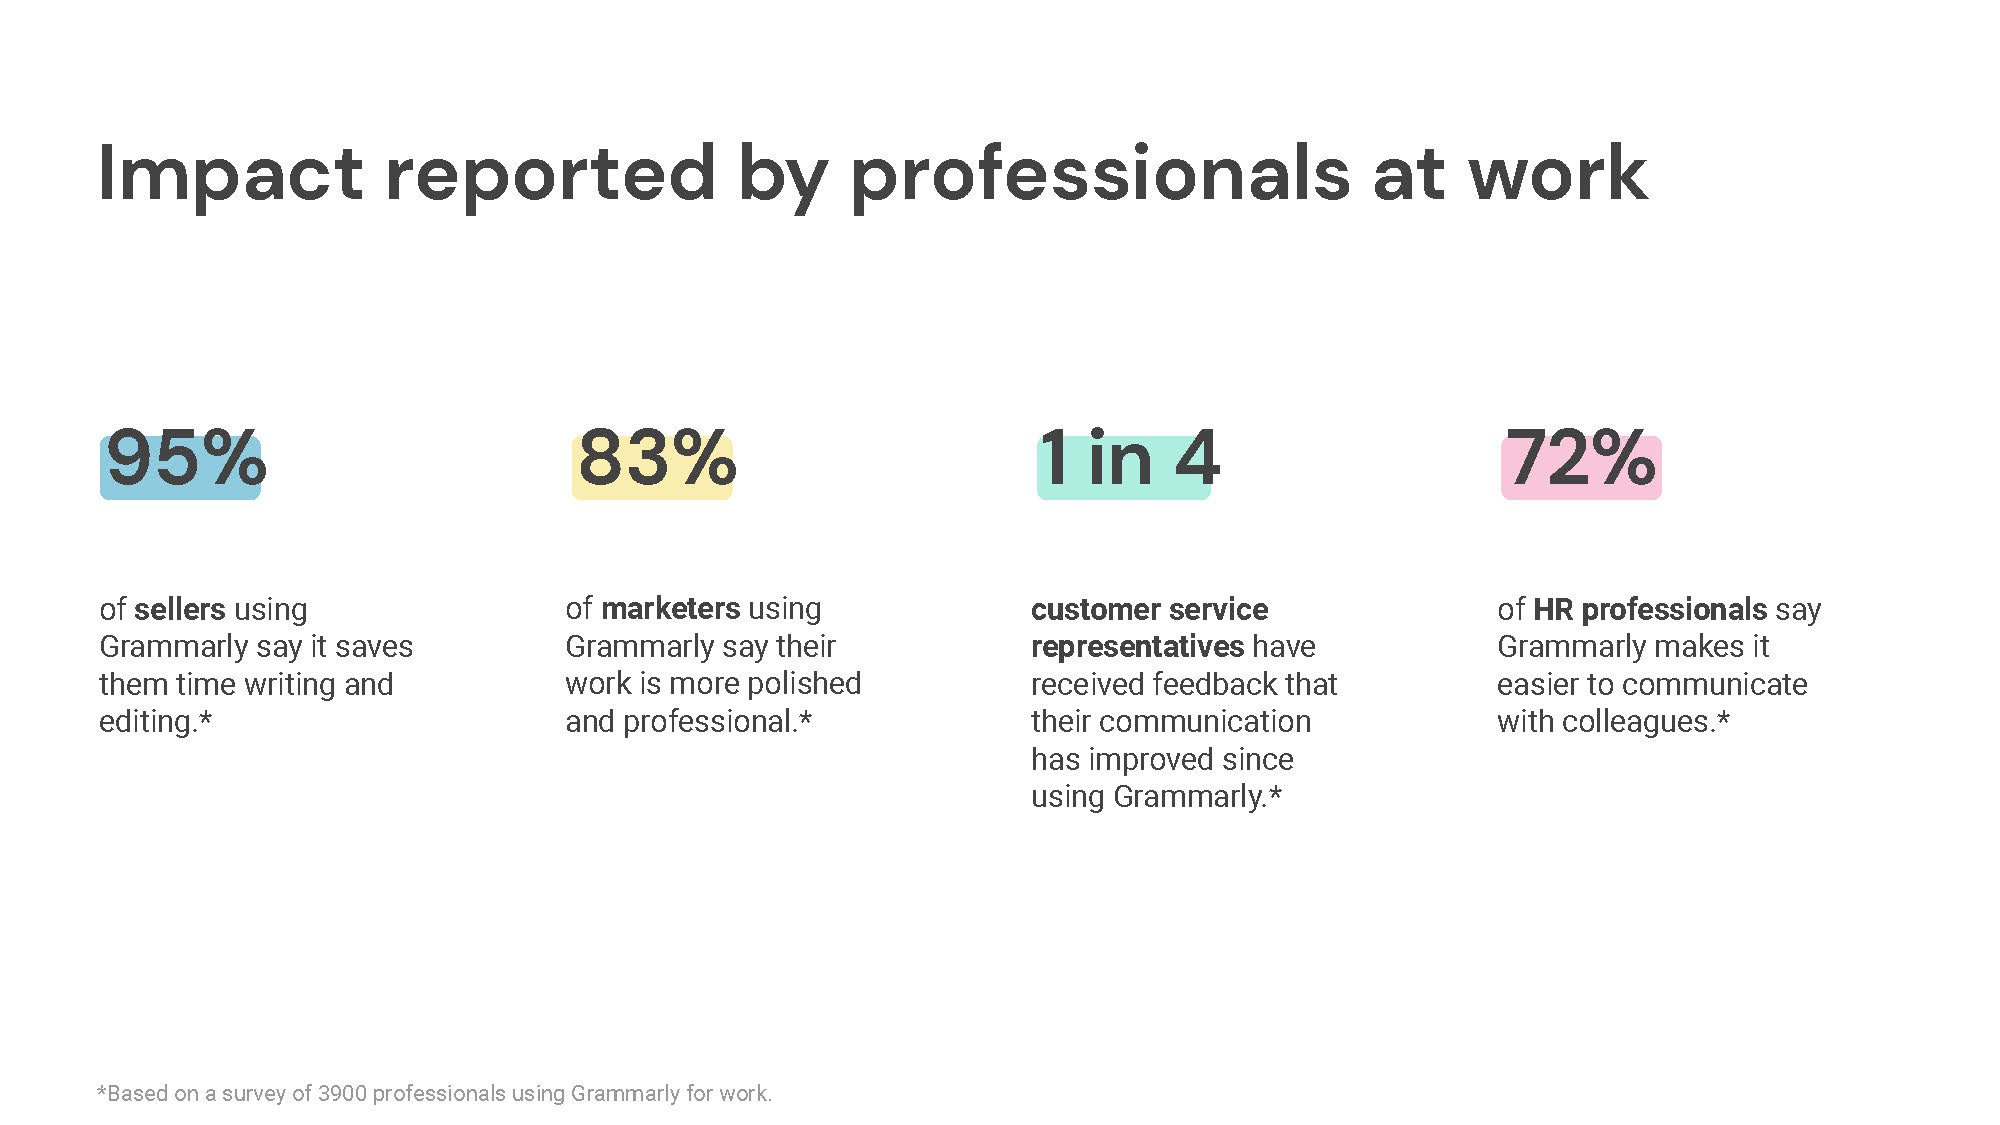
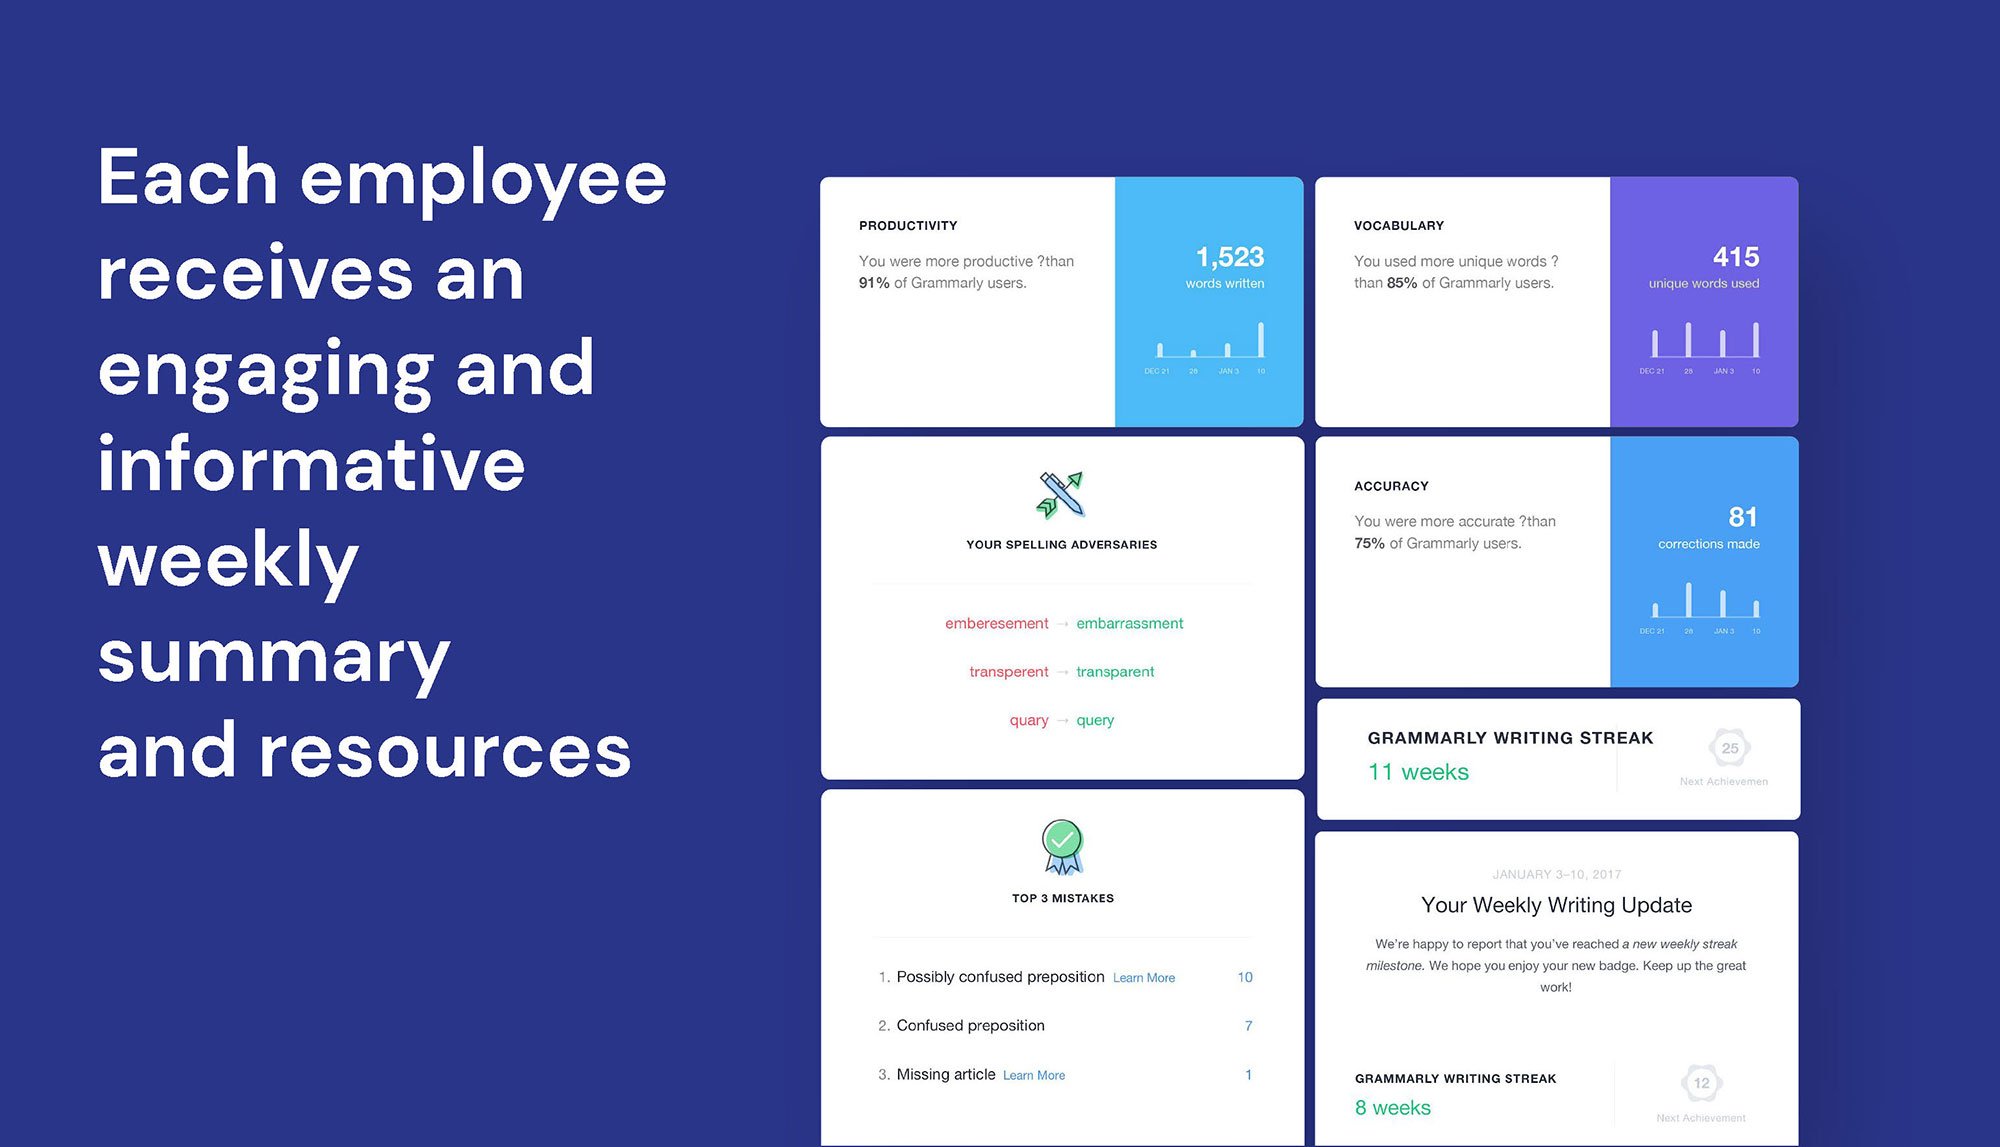
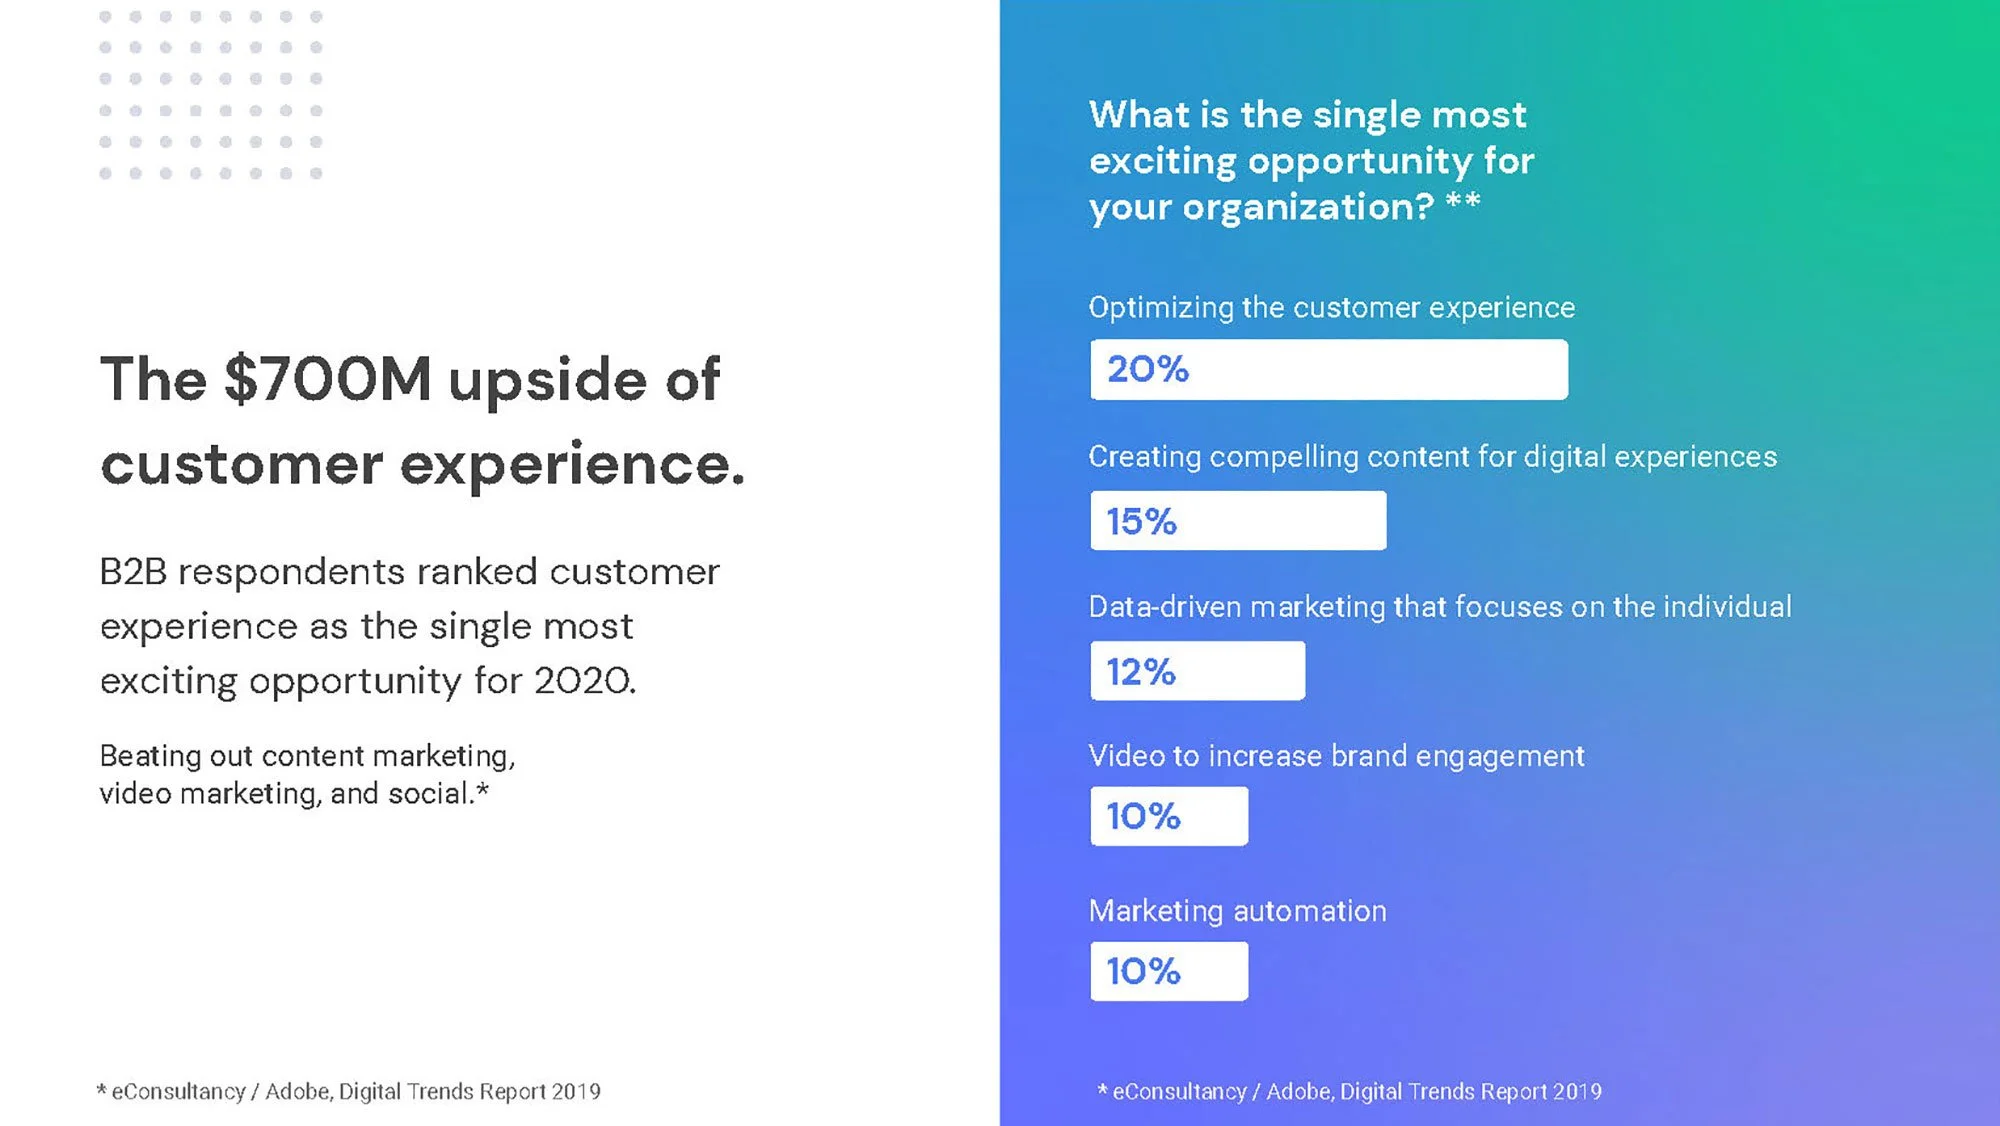
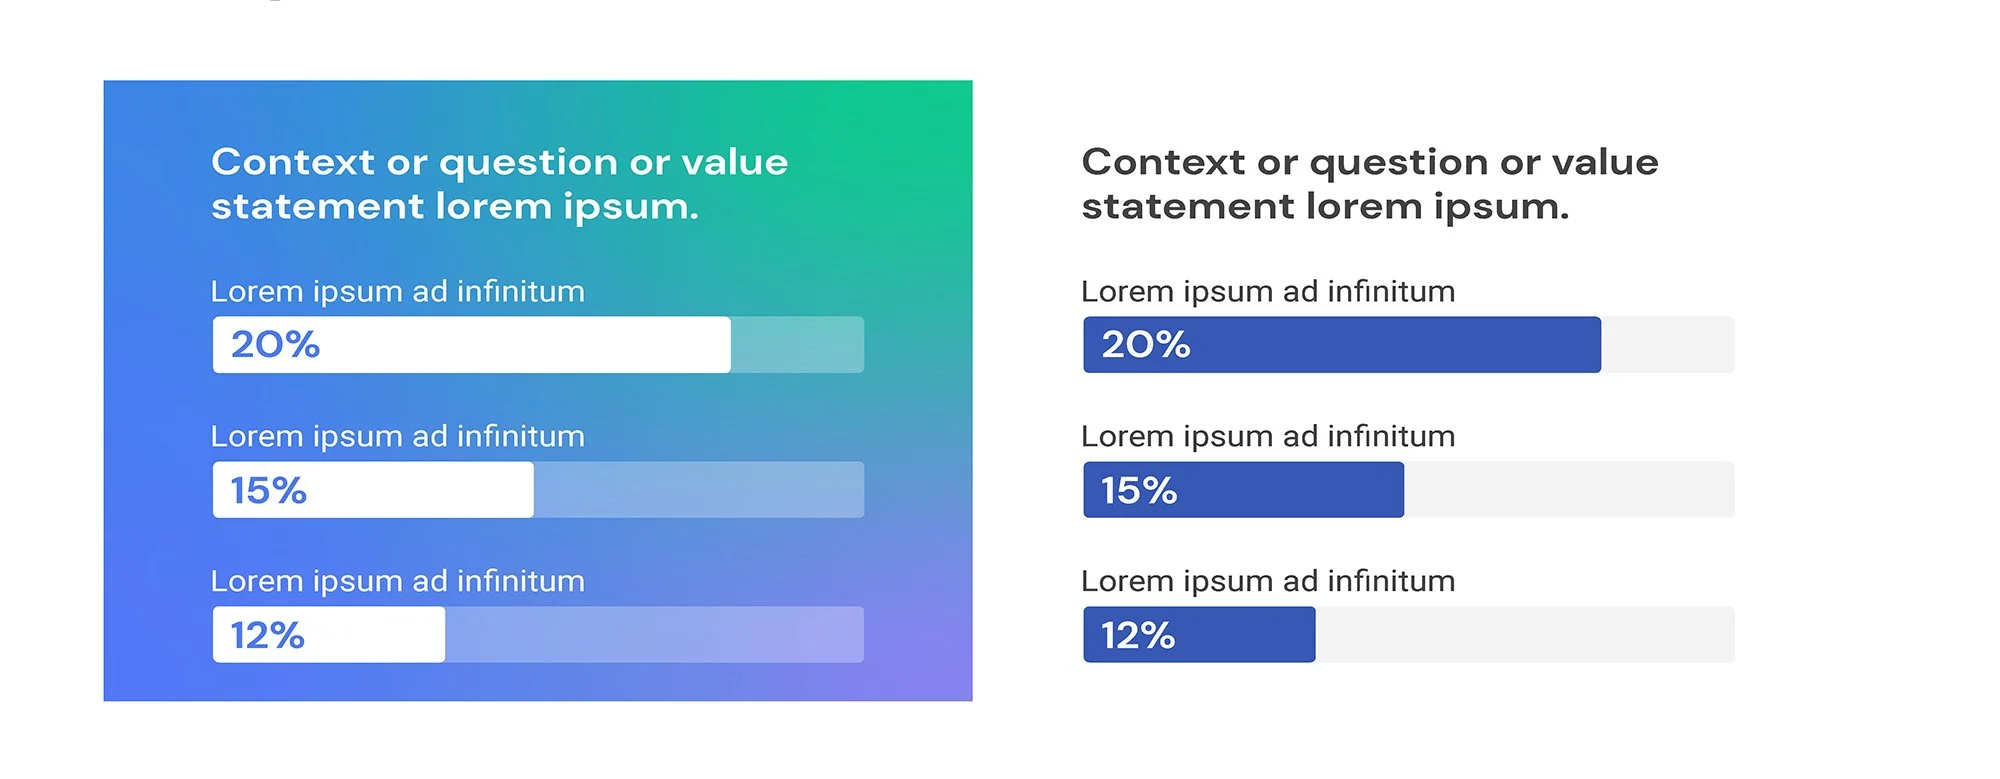
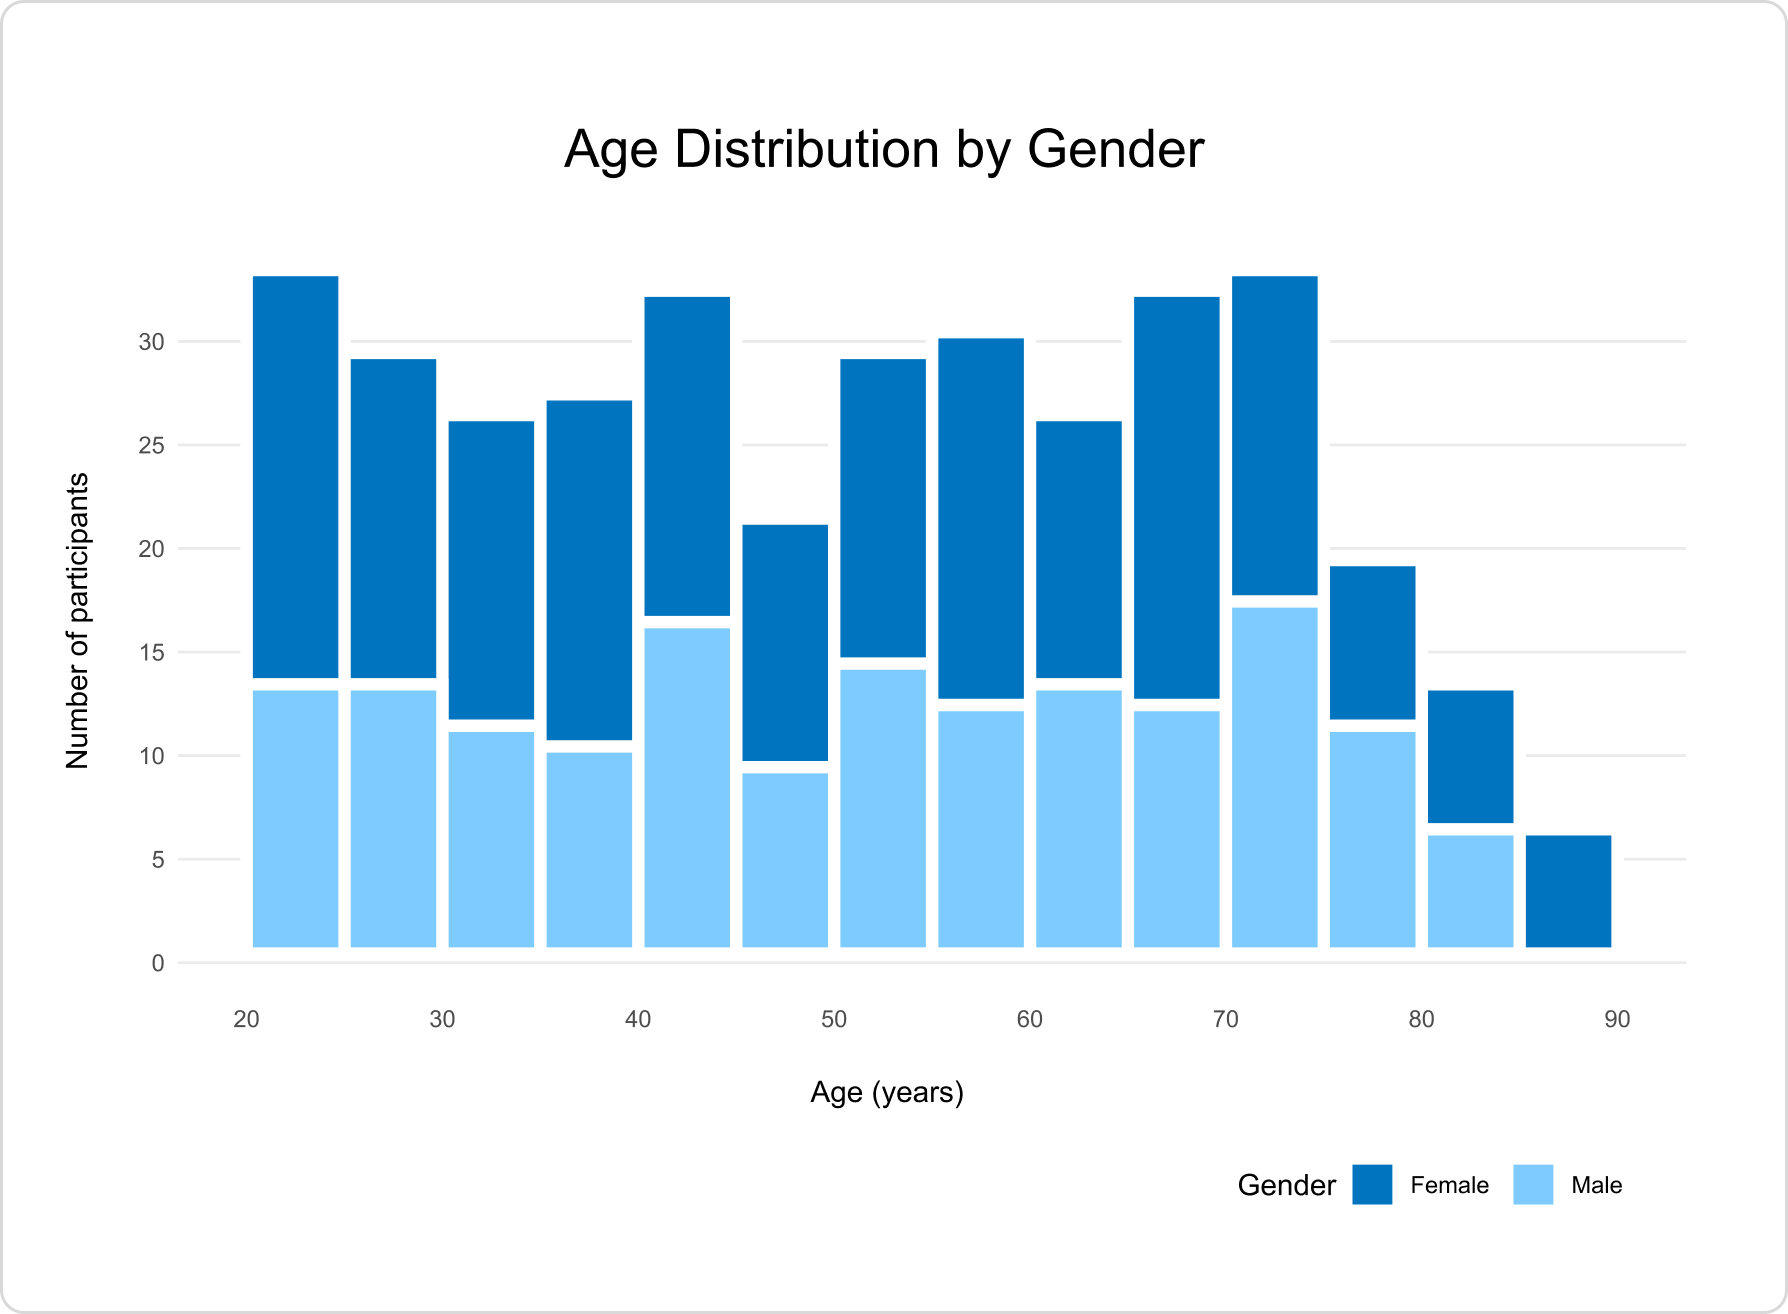
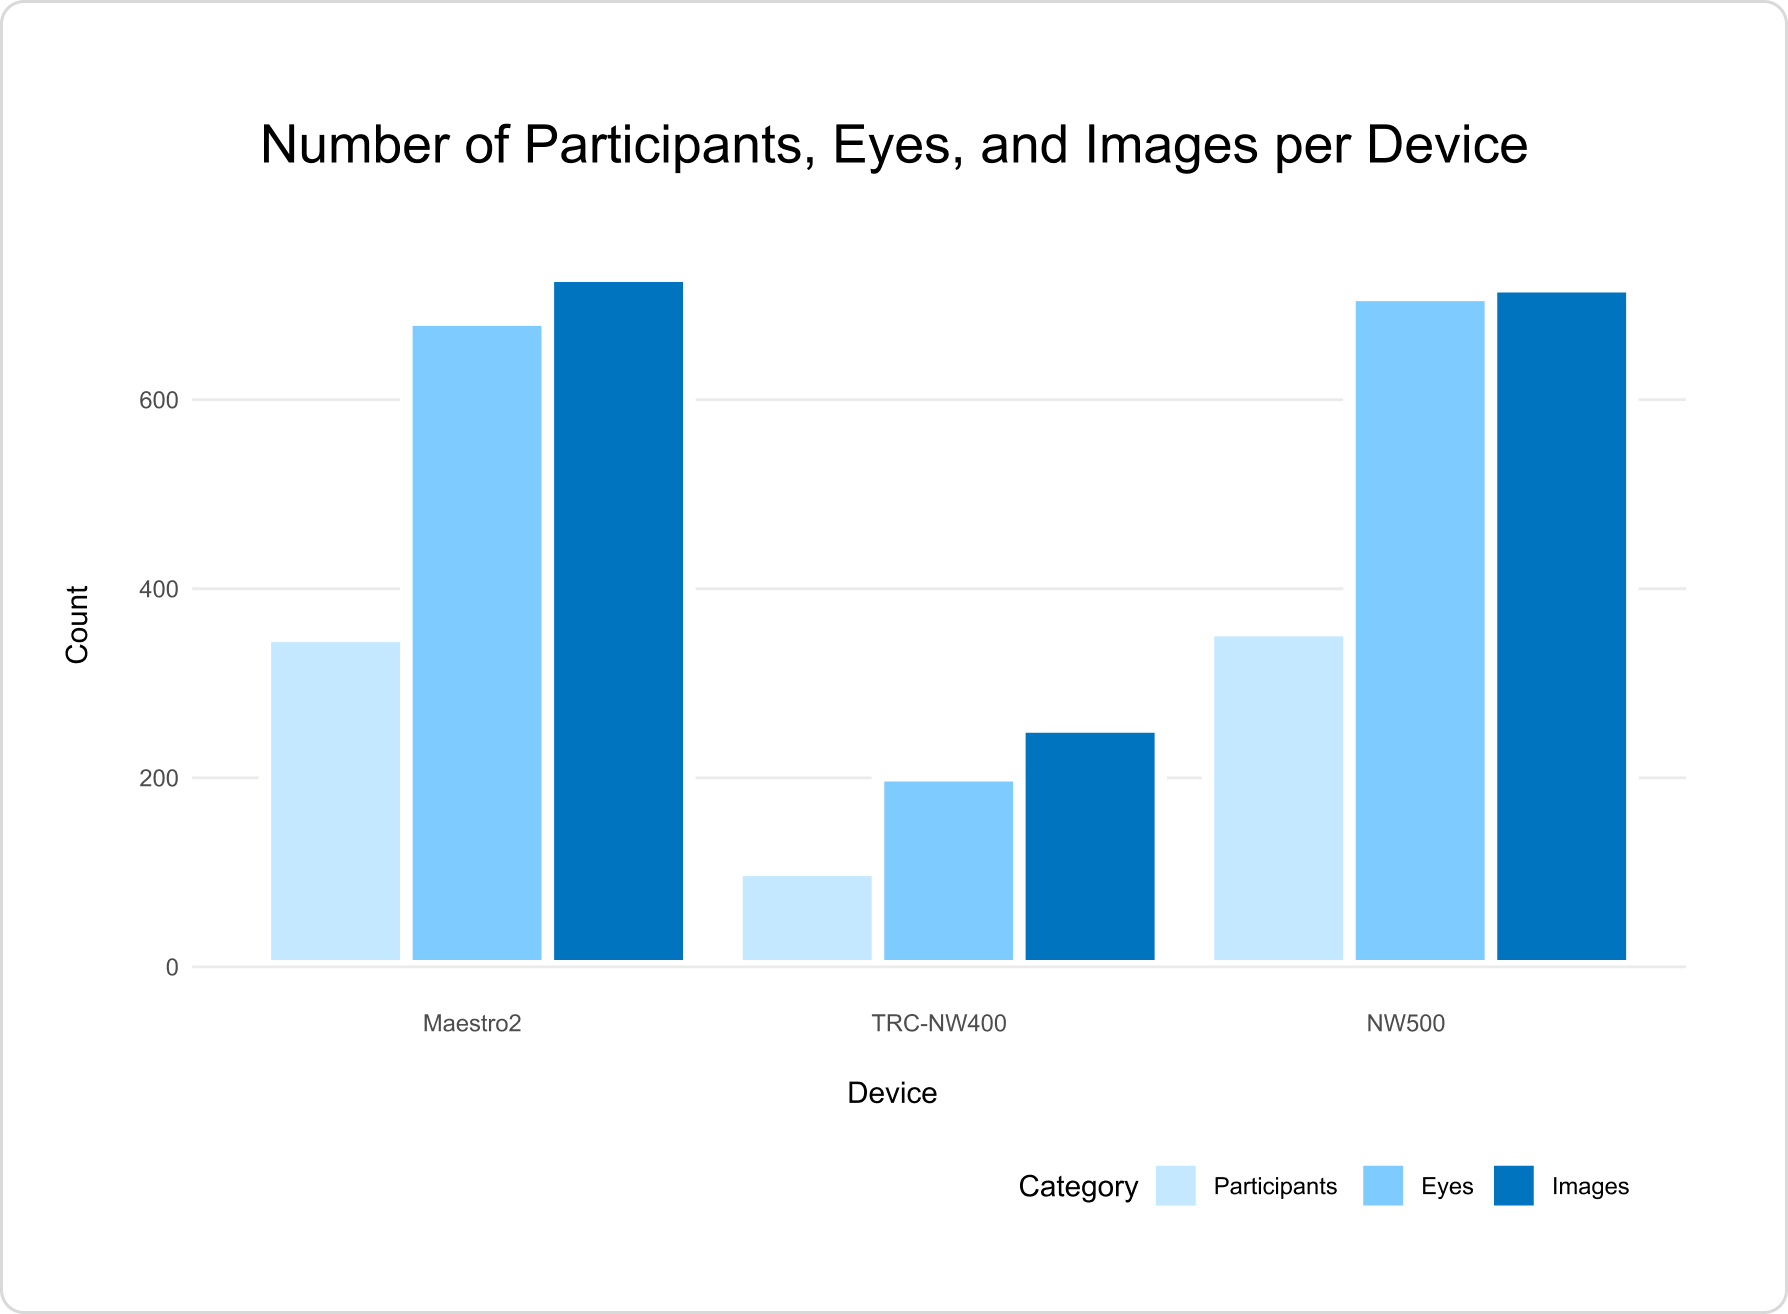
Sample visualizations for website and app
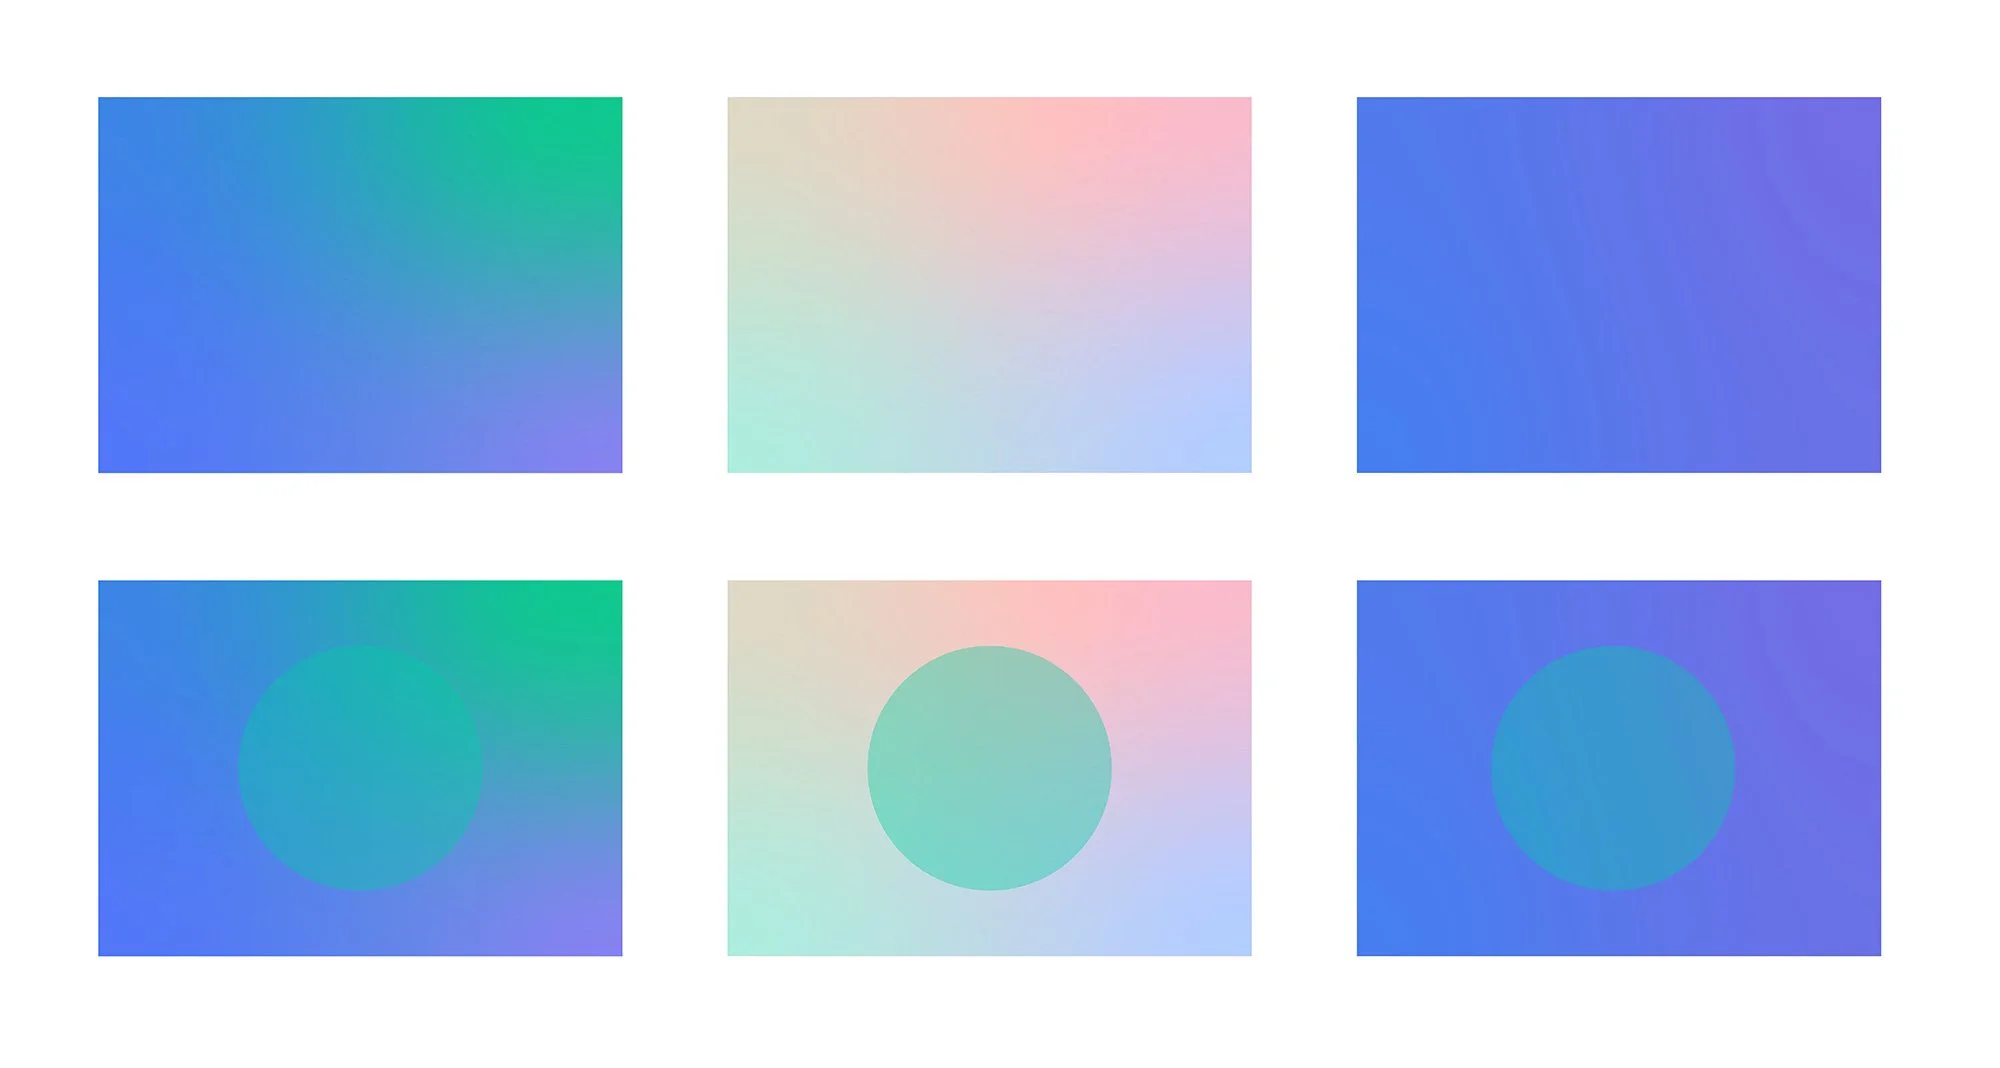
Data viz guidelines